
Student achievement data
University of Advancing Technology is accredited by the Higher Learning Commission (hlcommission.org), an institutional accreditation agency recognized by the U.S. Department of Education. The Higher Learning Commission (HLC) expects its institutions to provide information for students and the public regarding student achievement. Below, you will find information regarding UAT's retention and completion rates, as well as other data points we have deemed representative of student success according to our mission:
TO EDUCATE STUDENTS IN ADVANCING TECHNOLOGY WHO INNOVATE FOR OUR FUTURE.
While UAT is required to present completion and retention data, we have also included data on Student Innovation Project completion, Boards scores (both a requirement to graduate) and workplace readiness. The Student Innovation Project is the graduation requirement to innovate and invent, comparable in format to a traditional master's thesis, at the undergraduate level. Boards are a presentation of a student's portfolio of completed works and projects to a faculty subject matter expert panel, demonstrating the mastery of their degree objectives. This portfolio of works is completed through participation in real-world community and industry projects, 48-hour weekend production jams and more. Students demonstrate workplace readiness by completing apprenticeships and internships, where they are mentored by faculty and assessed for both hard and soft-skills by their employers.
All of these assessments are elements of UAT's Synchronic Learning Model designed to produce superior graduates.
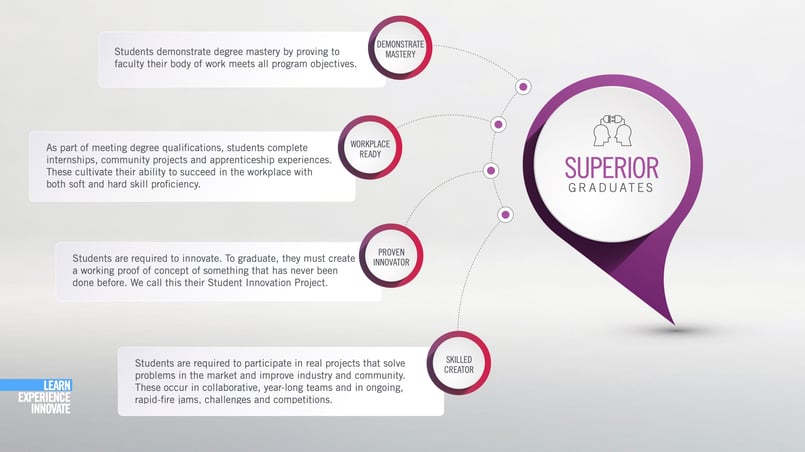
These additional data points demonstrate that UAT's graduates are skilled technology creators and innovators. This data directly feeds the assessments used to evaluate UAT's performance against its Institutional Ends, which are the performance measures that tie directly back to our Mission, ensuring we are always executing on it.
For further information on UAT's Mission and how it is served by our Institutional Ends, visit this page:
https://www.uat.edu/mission-vision-values
STUDENT COMPLETION
UAT's statistics on retention, completion and student demographics are available at the College Navigator site or on our U.S. Department of Education College Scorecard.
TOTAL COMPLETIONS: NUMBER OF AWARDS COMPLETED BETWEEN JULY 1, 2024 - JUNE 30, 2025*
| Associate Degree | Bachelor's Degree | Master's Degree | Postbaccalaureate Certificate |
| 160 | 109 | 44 | 21 |
Graduation Rates for full-time, first time degree seeking students who began their studies at UAT in Fall 2018 and completed within 150% of "normal time": 31%
4-year average completion rate (Fall Cohort 2016 – 2019): 37%
4-year average transfer-out calculation (Fall Cohort 2016 – 2019): 21%
Retention Rates for First-Time, Full-Time Students Pursuing Bachelor's Degrees: 74% of the students who began in Fall 2024 returned in Fall 2025.
2025 STUDENT RETENTION**
Semester to Semester Persistence
| Spring Semester 2025 | Summer Semester 2025 | Fall Semester 2025 | |
| Undergraduate | 90.20% | 88.90% | 89.82% |
| Graduate | 93.75% | 92.31% | 96.10% |
SUPPLEMENTAL COMPLETION AND ACHIEVEMENT DATA
The data below demonstrates student completion and outcomes. For anecdotal information on student achievement and UAT alum post-graduation highlights, visit:
https://www.uat.edu/student-accolades.
STUDENT INNOVATION PROJECT COMPLETION RATE
In this data, "Number of Students" indicates the total number of students presenting Student Innovation Projects (SIP) at the end of the noted semester. The "SIP Completion Rate" indicates the percentage of students that presented and passed/met all expectations of their Innovation Project as a requirement of their graduation, detailed in the student catalog.
STUDENT INNOVATION PROJECT SCORES BY CATEGORY
The categories below are used to describe the inventiveness of the projects of those students who complete and present their SIP projects at the end of each term. While students receive Pass/No Pass grades on their transcripts, this evaluation is used to measure the thoughtfulness and inventiveness of the project in accordance with our Thinkers Fundamental End. "Meets Standard" indicates the student successfully created an innovative, new technical concept or product. "Inventive" means the student's project exceeded expectations. "Market Viable" means with some mentoring, funding and additional guidance, the student has created an innovation that could effectively be taken to market.
 AVERAGE BOARDS SCORE
This data shows average scores of student boards (portfolio). Boards are presented to and scored by faculty subject matter experts.The bars indicate the total number of students presenting in that term, while the lines indicate the average portfolio score overall and split by modality. The dotted line indicates the score required to pass (3).
APPRENTICESHIP/INTERNSHIP COMPLETION & PERFORMANCE
The following two graphs show the completion rate of internships and employer satisfaction. All on-campus undergraduate students are required to complete an apprenticeship/internship as part of their courses. Online students may complete an internship for elective credit. In the first graph, the total number of students attempting an internship and the percentage who successfully complete. Because internships are actual courses, students receive letter grades on their transcripts and they are also evaluated by the employer. In addition to technical knowledge, employer evaluations include an assessment of students' workplace soft skills.


*As reported in the 2025-26 IPEDS Completions, Graduation Rates, and Fall Enrollment Surveys
**Each semester retention is finalized within three weeks of the semester end date. The Fall 2025 retention statistics were calculated based on overall retention (average of all modalities) for the semester ending December 21, 2025. The overall retention was calculated on February 4, 2026. Retention data displayed is based on a student’s persistence from one semester to the next. The formula used to determine semester persistence is the approved Arizona State Board for Private Postsecondary Education retention rate calculation. The starting population are all students expected to persist into that semester including: actively attending students, students on a leave of absence and graduating students whose graduation are not processed before the first day of the semester. To this, new enrollments for the semester are added to obtain the total semester enrollment. Withdrawals during that semester are subtracted from the period enrollment. The new total period enrollment is divided by the initial total period enrollment to calculate the retention percentage. The formula is written as followed: (Total Period Enrollment – Withdrawals)/Total Period Enrollment = Retention Rate. The calculation date for Total Period Enrollment is the day prior to the start of the following semester. For the Fall 2025 semester beginning on September 8, 2025, the Total Period Enrollment was finalized on January 13, 2026. The undergraduate retention rate includes all on-campus and online students. Applying this same calculation and points-in-time to the Spring 2025 and Summer 2025 semester retention calculations, the following is true: The Spring 2025 retention statistics were calculated based on overall retention for the semester ending May 4, 2025, the overall retention was calculated on May 30, 2025. For the Spring 2025 semester beginning on January 15, 2025, the Total Period Enrollment was finalized on May 11, 2025. The Summer 2025 retention statistics were calculated based on overall retention for the semester ending August 24, 2025, the overall retention was calculated on September 26, 2025. For the Summer 2025 semester beginning on May 12, 2025, the Total Period Enrollment was finalized on September 7, 2025.